Like many architects, we have begun to pay much closer attention to the embodied carbon associated with the materials we are specifying. All other things being equal, selecting a material with a lower global warming potential (GWP) is preferable. However, at this early stage, not many of us have a strong intuitive sense of how meaningful various GWP values might be. For instance, is 223 kgCO2e/m2 of insulation good or bad?
To present GWP values in a relatable way, we performed a study to compare the embodied carbon values for 11 commonly used types of insulation. The insulation products considered include two brands of standard XPS, two brands of next-generation XPS, polyiso, spray foam, EPS, stone wool, GPS, fibreglass batts, and blown cellulose.
Insulation is somewhat unique among building materials in that one of the primary reasons it is incorporated in buildings—to reduce energy flow through the building envelope—directly impacts the building’s operational emissions.
In our study, we contrive a familiar scenario: a homeowner with an uninsulated bearing masonry house wishes to add insulation to reduce their energy costs and increase comfort in the home. Specifically, they would like to increase the effective R-value of their home from its current performance of R4IMP to a value more in line with the current building code, R24IMP.
We calculate the embodied carbon associated with the amount of each type of insulation required to achieve that level of thermal resistance. We then calculate the quantity of emissions that is avoided each year the house is operated with the higher level of insulation (due to the reduction in heating energy needed to maintain the internal temperature of the house).
The conclusion of our study is a payback analysis that expresses the relationship between the emissions associated with the production of each insulation and the emissions avoided each year due to the presence of the insulation. Said another way, we identify how long it takes for the operational savings (reduced operational emissions) to exceed the investment (embodied carbon) in the insulation.
We assumed the house was heated with natural gas for our baseline scenario. We also contemplated an alternative scenario where the house was upgraded to a heat pump. The relative performance of each insulation does not change in the heat pump scenario. However, the operational emissions resulting from the heat pump are much lower than with gas heating. As such, the notional payback periods are significantly longer in the heat pump scenario (though the total carbon emissions in any period of time would be lower).


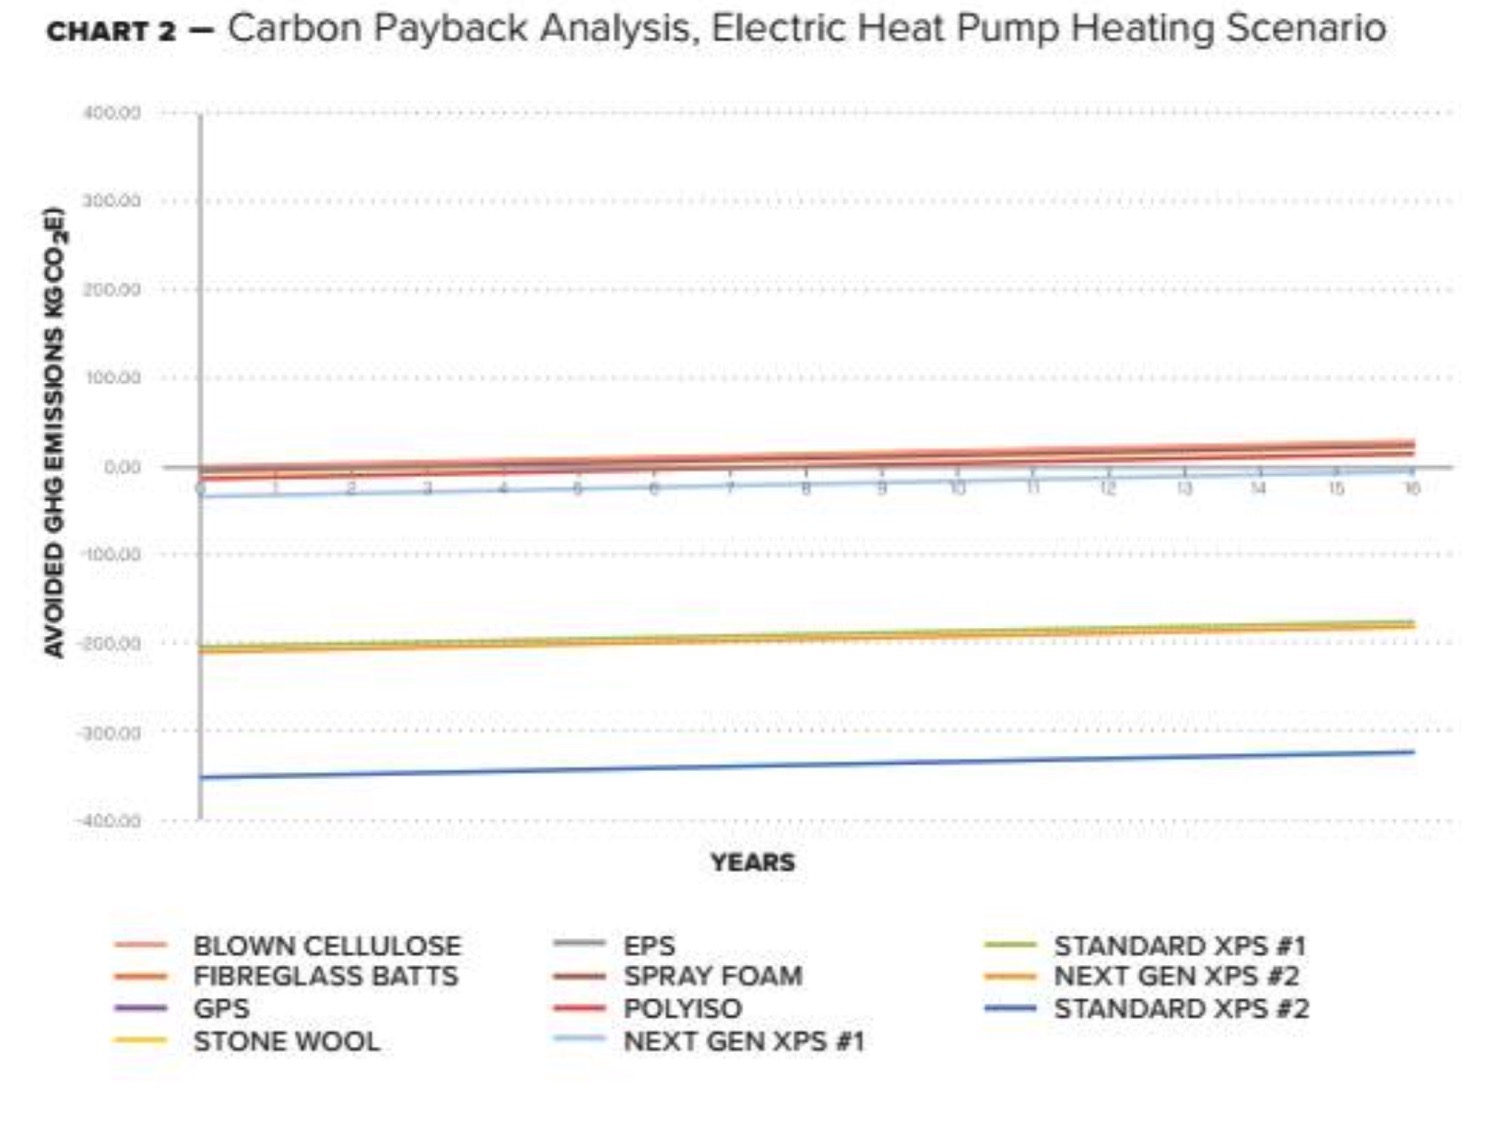 The findings of this analysis are illustrated in the three graphs above. Several conclusions bear mentioning:
1
The operational emissions associated with natural gas heating are approximately 12 times greater than for electric heat pump heating. This translates into much shorter payback periods for the insulation materials considered.
2
XPS is an outlier in this selection of materials, with a GWP 15 to 20 times greater than the other materials. In the electric heat pump scenario, it is not reasonable to expect the operational carbon savings to ever outweigh the embodied carbon of the material itself.
3
One of the next-gen XPS products in our analysis has a much lower GWP than either brand of traditional XPS considered. However, it is still twice as high as the other non-XPS products considered in the study.
4
Blown cellulose insulation has the lowest GWP value of the group, as might be expected given the relatively low amount of processing involved in producing the material. That said, it needs to be contained in a wall cavity or similar container, and therefore might not be applicable in as many situations as the other board and batt products considered.
5
Polyiso, EPS, stone wool, and GPS are all board or semi-rigid batt products, and all have GWPs that are significantly lower than XPS. In situations where blown cellulose insulation is not a suitable choice, these products—stone wool and GPS in particular—offer considerable flexibility in terms of suitable installations, along with quite good embodied carbon values.
It is our hope that this analysis provides a somewhat more intuitive sense of scale for the embodied carbon quantities of these materials. The study also underscores the significant differences in operational emissions resulting from gas versus electric heat pump systems.
The Effect of Varying Levels of Insulation on Total Carbon
After examining the relationship between embodied carbon and operational carbon savings over time for a given quantity of insulation (R20IMP), we thought it would be interesting to also look at the effect of varying levels of insulation.
In this second analysis, we work with the same 11 insulation materials we looked at in the first analysis. We set a 30-year service life for the materials, and we make a few assumptions about the building the insulation is being applied to. Specifically, the building is in Toronto, Ontario; its interior will be maintained at 20°C (giving 93 kKh per year); and it is being heated with natural gas (0.183 kgCO2e/kWh).
We then look at the two component aspects of total carbon: the operational value and the embodied value.
For this analysis, we define “operational carbon” as the amount of emissions produced by the heating plant to maintain the interior temperature of 20°C for 30 years, at each specified level of insulation.
We start the analysis at R1IMP and look at each integer value up to R40IMP. (Note that the type of insulation is irrelevant to this part of the analysis, as the heat flow through the hypothetical envelope is a function of the R-value, regardless of the insulation used to achieve the given level of resistance.)
 Chart 3, above, shows the operational carbon values for R1IMP to R40IMP. From the shape of the curve, we see that adding insulation provides diminishing returns as the R-values increase. The carbon value drops by 50% from R1IMP to R2IMP, as doubling the resistance halves the heat flow through the assembly. By contrast, the energy savings (and carbon reduction) from R39IMP to R40IMP is only 2.5%.
The second piece of the puzzle is the embodied carbon value. Chart 4, below, shows the 11 materials and the embodied carbon values for 1m² of each, for thicknesses delivering R1IMP up to R40IMP.
 The relationship between thickness of insulation and R-value is linear—e.g. R20IMP of EPS is 20 times thicker than R1IMP of EPS—and the chart reflects this. The steepness of each line is a reflection of the GWP of each material, where a higher GWP gives a steeper line.
What we’re calling “total carbon” is simply the addition of these two charts. By adding the embodied values to the operational carbon values, we get Chart 5.
 This produces an interesting effect—an optimization function. At lower levels of insulation, the operational savings of small amounts of additional insulation tend to drive the curve. As the levels of insulation get higher, the marginal savings accrued by each additional R-value diminish, but the embodied carbon value increases linearly. The result is that at some point for each material, the amount of embodied carbon being added outweighs the operational savings that results, producing an inflection point on the chart, where the curve flattens and begins to bend upwards. As the operational savings are consistent for all of the materials, the specific inflection point for each material is determined by that material’s GWP value. Higher GWP values result in inflection points at a lower R-values.
Observations:
1
The total value of emissions indicated on the y-axis is the truly important piece of information in this analysis. Choosing an insulation material that will result in the lowest total carbon output while meeting the requirements of the application is the appropriate objective.
2
The 30-year service life considered is an arbitrary value. If a shorter service life were considered, the total carbon values would be lower, and the inflection points would happen at lower R-values (as the total operational emissions considered would be lower, giving more weight to the embodied emissions). The converse is true for considerations of service life periods longer than 30 years.
3
Three of the four XPS materials considered produce inflection points (or total carbon minimums) at insulation levels below current OBC (SB-12) code requirements for walls above grade in new home construction. It would be desirable to select a material with a lower total carbon value at the code-required level of insulation.
4
All of the non-XPS materials show values for total carbon that are still declining at R40IMP levels of insulation. These materials do have inflection points; however, they occur at higher R-values that are not typical in construction. (For instance, the inflection point for polyiso is ~R65IMP. The inflection point for blown cellulose would be closer to ~R160IMP.)
5
This analysis considered natural gas as the fuel source for heating. If we consider an electric heat pump connected to the Ontario grid as the fuel source (see Chart 6) the effect of operational carbon on the shape of the graph reduces dramatically, and the curves more closely resemble those describing the embodied carbon values for each material (i.e. Chart 4.) At KPMB LAB, we strongly endorse the electrification of buildings as a critical strategy for mitigating climate change. The heat pump heating scenario is the desired condition for all buildings and should inform material selection. In all heating system scenarios, our analysis emphasizes the importance of selecting the material with the lowest GWP that meets the requirements of the specific application.
Geoffrey Turnbull, Jonathan Graham, David Constable and Sahana Dharmaraj are part of KPMB LAB, a research group within Toronto-based architecture firm KPMB. For source material related to this research, visit KPMB.com/lab.
 Contributors:
Geoffrey Turnbull
OAA, LEED AP, CPHD
DIRECTOR OF INNOVATION
Jonathan Graham
SUSTAINABILITY ANALYST
David Constable
OAA, LEED AP, CPHD
PRINCIPAL
Sahana Dharmaraj
LEED Green Associate
INTERN ARCHITECT