 At your annual checkup, your doctor uses shortcut ratios like body mass index and blood pressure to quickly understand your physical health. For design firms, there are also shortcut ratios—two in fact—that can provide valuable insights into your practice’s fiscal health.
These two ratios are Net Fee per Full Time Equivalent (NF/FTE) and Operating Profit Margin (OPM). The recent Canadian Architectural Practices Benchmark Survey provides component data for these two shortcut benchmarks. Let’s take a look at each part individually.
Net Fee (NF) represents all the money generated by a firm, after excluding subconsultants and reimbursable expenses. Net Fee can go by various names on a profit and loss statement, such as Net Service Revenue, Net Operating Revenue, or Net Billings, but all are synonymous with Net Fee.
Full Time Equivalent staff (FTEs) accounts for the total number of full-time and part-time individuals employed by the firm, including principals, professionals, technical experts, contract labour, and administrative staff. This number is not found on your profit and loss statement, so a manual count of FTEs for any given year is necessary.
Net Fee divided by the number of Full Time Equivalent staff (NF/FTE) provides a sense of how well the firm is leveraging its payroll and operating expenses to complete client work.
Operating Profit (OP) is the funds available after deducting payroll and operating expenses from net fees. It’s important to understand that Operating Profit is not the money that goes into the owner’s pockets. It includes funds for capital expenditures, corporate taxes, debt reduction, staff profit sharing, bonuses, funds for growth, a rainy-day fund, and—after all those commitments have been met—distributions to the firm’s owners.
Operating Profit divided by Net Fee yields Operating Profit Margin (OPM). This provides a valuable gauge of the firm’s overall operational efficiency, allowing for accurate comparisons within the industry, as well as an indicator to track changes from year to year within the firm itself.
The recent Canadian Architectural Practices Benchmark Report provides both financial and non-financial data focussed exclusively on Canadian practices. Organizations like Deltek, PSMJ and the AIA offer highly detailed industry surveys for design firms primarily in the US. The table below captures a composite of the NF/FTE and OPM of small/midsized firms in recent surveys by these organizations.
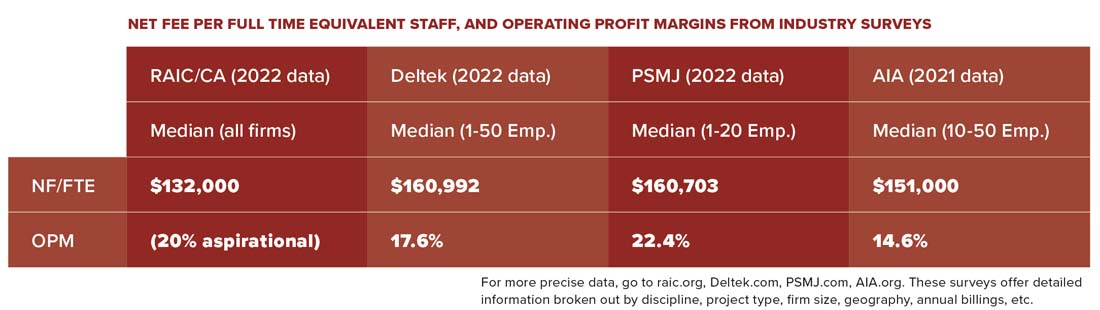 The Canadian Architectural Practices Benchmark Report indicates that the median NF/FTE for all firms in Canada is $132,000.
The survey does not provide an actual median for profit margins, but it does indicate that firm leaders in Canada aspire to achieve 20% profit margins. However, an admittedly non-scientific median for actual operating profit margin of small/midsized firms in Canada—based on the relation between NF/FTE and OPM in broader surveys of North American firms—is likely around 14%.
These benchmarks will be close enough when conducting a high-level comparison between your firm and the overall industry. More importantly, you can use these benchmarks to compare your firm’s past performance to its present performance, and as a handy tool to set targets for the future.
Let’s employ these two shortcut ratios to compare three hypothetical firms with very different fiscal-health profiles—each with 10 FTEs, including two principals. Refer to the table above for a quick comparison of these three examples and their associated ratios.
Struggling Firm:
This 10 FTE firm has averaged $1.0M in net fees ($100,000 NF/FTE) at 5% OPM over the past three years. The financial performance of this firm is in dire need of improvement if it is to survive.
The firm generates $50K (5% of NF) in operating profits. At that level of profitability, this firm is likely facing challenges with cash flow, growth potential, return on risk to principals and so on.
Total payroll is 65% of net fee ($650K: 2 Principals averaging $93K, 8 staff averaging $58K). The firm is not able to offer market salaries for principals and staff. This may lead to high turnover and many other payroll-related challenges.
With limited resources for operating expenses, the value of the firm is likely marginal at best.
Strong Firm:
This 10 FTE firm has averaged $1.6M in net fees ($160,000 NF/FTE) at 25% OPM over the past three years. This firm is a solid performer in comparison to the industry.
The firm generates $400K (25% of NF) in operating profits. As a result, the firm can invest in areas like technology, marketing, and growth while also providing a healthy return on risk and investment to principals.
This firm allocates 50% of net fees to payroll ($800K: 2 Principals averaging $120K, 8 staff averaging $70K). At this level of payroll, the firm can offer salaries to principals and staff that make it competitive in attracting and retaining top talent.
With sufficient resources for operating expenses, the value of the practice is built over time, providing a healthy exit option for principals.
Super Firm:
This 10 FTE firm has averaged $2.0M in net fees ($200,000 NF/FTE) at 35% OPM over the past three years. This firm has established itself as a high performer in the industry.
The firm generates $700K (35% of NF) in annual operating profits. This is most likely the result of the firm’s focused position in the marketplace and effective project execution.
Payroll is 44% of net fees ($880K: 2 Principals averaging $140K, 8 staff averaging $75K). This super firm is able to provide salaries to principals and staff that are above market rates, making it a formidable competitor in attracting and retaining top talent. In addition, the firm can offer generous bonuses and/or profit sharing.
A healthy budget for operating expenses allows the firm to create a virtuous cycle that helps to ensure it is attractive for an internal or external sale when the principals are ready to exit the firm.
As you can see from the Canadian Architectural Practices Benchmark data and other surveys, there are many firms out there that are Super, and many more that have achieved the status of Strong Practice. These firms come in all shapes and sizes—but they all use proven strategies to move up the continuum from struggling, to strong, and beyond.
Your doctor uses body mass index and blood pressure to gauge your physical health. Net Fee per Full Time Equivalent and Operating Profit Margin offer potent shortcuts to understand and improve the overall fiscal health of your practice. Is it time to give your firm a check-up?
Rick Linley is the former COO of a 200 FTE, multi-disciplinary, multi-office architecture and engineering firm. He is principal of Strong Practice Strategies, a niche consultancy helping leaders of emerging and evolving design firms to strengthen their practices. Rick is also the author of Scoreboard Your Practice: 7 Numbers to Understand Your Design Firm’s Financials (FriesenPress Editions, 2022).
This article is part of Canadian Architect’s series on the Canadian Architectural Practices Benchmark Report (2023 Edition). The full report is available for purchase from the RAIC.
See all articles in the November issue
Read additional articles in Canadian Architect’s series on the Canadian Architectural Practices Benchmark Report (2023 Edition):
· Benchmark Report 2023: The State of Canadian Architectural Practice
· Benchmark Report 2023: Mixed Prospects
· Benchmark Report 2023: Architecture and Capital “M” Marketing
· Benchmark Report 2023: Firm Expectations—Managing Remote Work and Flexibility
· Benchmark Report 2023: Women in Canadian Architecture—An Update
· Benchmark Report 2023: Competitive Compensation
· Benchmark Report 2023: Looking Ahead—Succession Planning and Firm Value
· Benchmark 2023: Future Forward—Adaptive Change in Architecture Education and Practice
